ciaranob
Well-Known Member
- Joined
- Jul 3, 2021
- Threads
- 83
- Messages
- 3,547
- Reaction score
- 2,639
- Location
- Houston, TX
- Vehicles
- CT4S 2022 Mini Cooper S 2024 Electric in 2025/6
- Thread starter
- #1
Summary
1) PCM 'Guessometer' or 'GoM' Ranges using current SoC are the most optimistic and are calculations (predictions) biased towards the most efficient ride pattern recorded from a subset of your most recent trips.
2) Range derived from consumption data from your cars total trip history will provide an equivalent full SoC range that will always be lower than the max. Guessometer range.
3) With the correct OBDII tool you can get a reasonably accurate estimation of your SoH (how much you HV Battery has degraded). This will allow you to determine usable kWh and thus provide another measure of potential range at 100% SoC.
PCM range estimates should by default be considered maxima - despite oddly enough, something that is presented to you every time you start up your car, it is in reality simply a range you might attain with very diligent, efficient driving but otherwise quite optimistic. By contrast, if following an active PCM navigation route/PIRM estimates of SoC on arrival are in fact very accurate as in this special case the car is reacting to as-is conditions both in respect driving style but also terrain/climate etc. This is a distinctly different case to the Dash reported range and SoC when not using an entered active navigation route.
____________________________________
Some Data
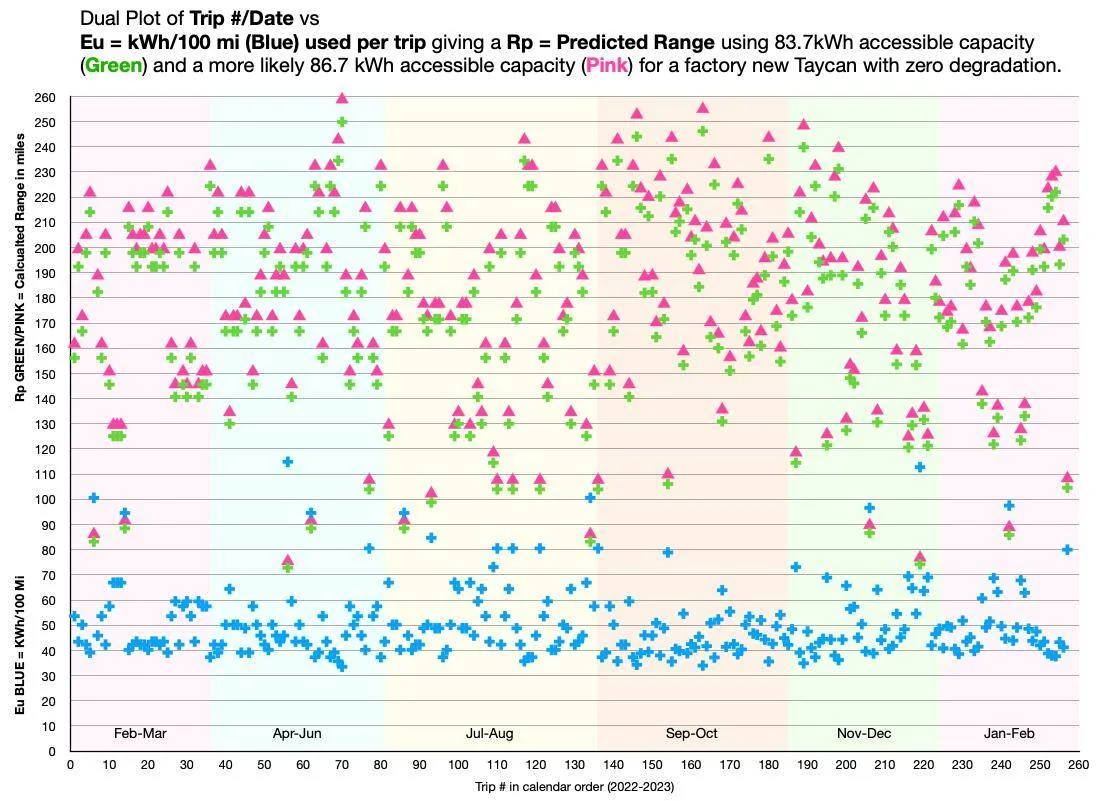
This chart records my entire trip history up to Sep. 2023. Data points in blue are calculations of max. range based off the reported consumption used for that trip. In green are max. ranges for a sample 50 charge sessions (consistent SoH) calculated by the PCM (Guessometer) for an equivalent 100% SoC (I always charge to 85% and use the associated GoM range to calculate range for 100% SoC).
Clearly the GoM Ranges are distinctly higher than those calculated using average consumptive data. However this should not be a surprise!

There has been a lot of back and forth on the range the PCM calculates and displays in your dash vs what can be calculated in respect kWh consumed over miles driven etc. - PCM 'Guessometer' vs actual 'Consumptive' range. The key differentiator here being that the GoM only uses recent driving trips and from these determines you most efficient driving style/terrain covered to (I believe) calculate a 'theoretical' maximum range if you stick entirely to that efficient driving model. By contrast consumptive data whilst averaged for each trip does not differentiate inefficient vs efficient trips and thus any Range calculation from these data will of course be lower than the 'theoretical' GoM predictions.
A key and very important exception and validated by numerous forum members, is the ability of the PCM Navigation trip planner/PIRM to predict arrival SoC from an entered map route which seems to be highly accurate. Without a mapped route, the PCM in not knowing what terrain you are about to drive or exactly how aggressive or passive you are about to be in your driving stye, it simply instead calculates a theoretical potential maximum range should you decide to drive in the most efficient way you have recorded/demonstrated to date for those predicted miles.
So again, when we calculate range from average efficiency numbers we are obviously not going to see the predicted maximums provided by the GoM. These efficiency averages are just that - they are derived from your full driving history not the last few trips, and are not showing/providing what the actual min-max or variance is around those averages. So again, we should of course expect ranges derived from average consumptive kWh per mile to be less than those provided by the GoM.
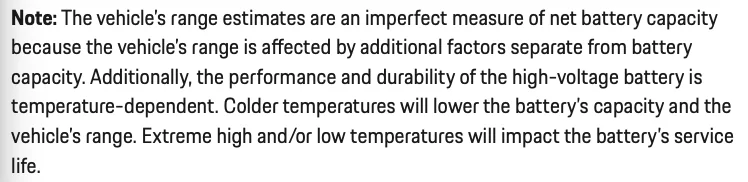
As an aside, it is worth noting the following in your warranty booklet:

The Baseline Soh thread on this Forum most definitely highlights the last point i.e. heat stress is the biggest factor in battery degradation (for a host of physical and chemical reasons beyond scope here). Note too that simply having your car sit in extreme hot climates will still degrade your battery i.e. it is not simply miles driven (in fact you could argue active cooling systems better protect the battery when being driven vs sitting static in heat!). Perfect example is my and another local Hot Climate zone car with identical Soh degradation with my car having less than half the miles driven.
Measuring SoH
Some ways to measure Soh for Consumptive/Soh derived range:
OBDII Tool:
The OBDII tool lists two useful measures (and we have multiple PIWIS 'quick' ECU reads that exactly match and validate equivalent OBDII data to date):
1) your current HV Battery 'Soh' or State of Health and
2) current 'Battery Energy' - basically kWh remaining of usable battery power at your current Battery SoC (State of Charge).
Example (real case) Forum car:
OBDII SoH reads = 88%
Note: A new Taycan with PB+ has 86.7 kWh (not the published 83.7) unbuffered or usable battery energy.
So with 12% degradation this car's current usable battery energy at 100% SoC is 86.7*.88 = 76.3 kWH.
PCM SoC at time of OBDII measurements = 75%
OBDII Battery Energy value reads = 57.15 kWh
So we can separately derive this car's current usable SoH from Battery Energy and SoC as 57.2/0.75 = 76.3 kWh
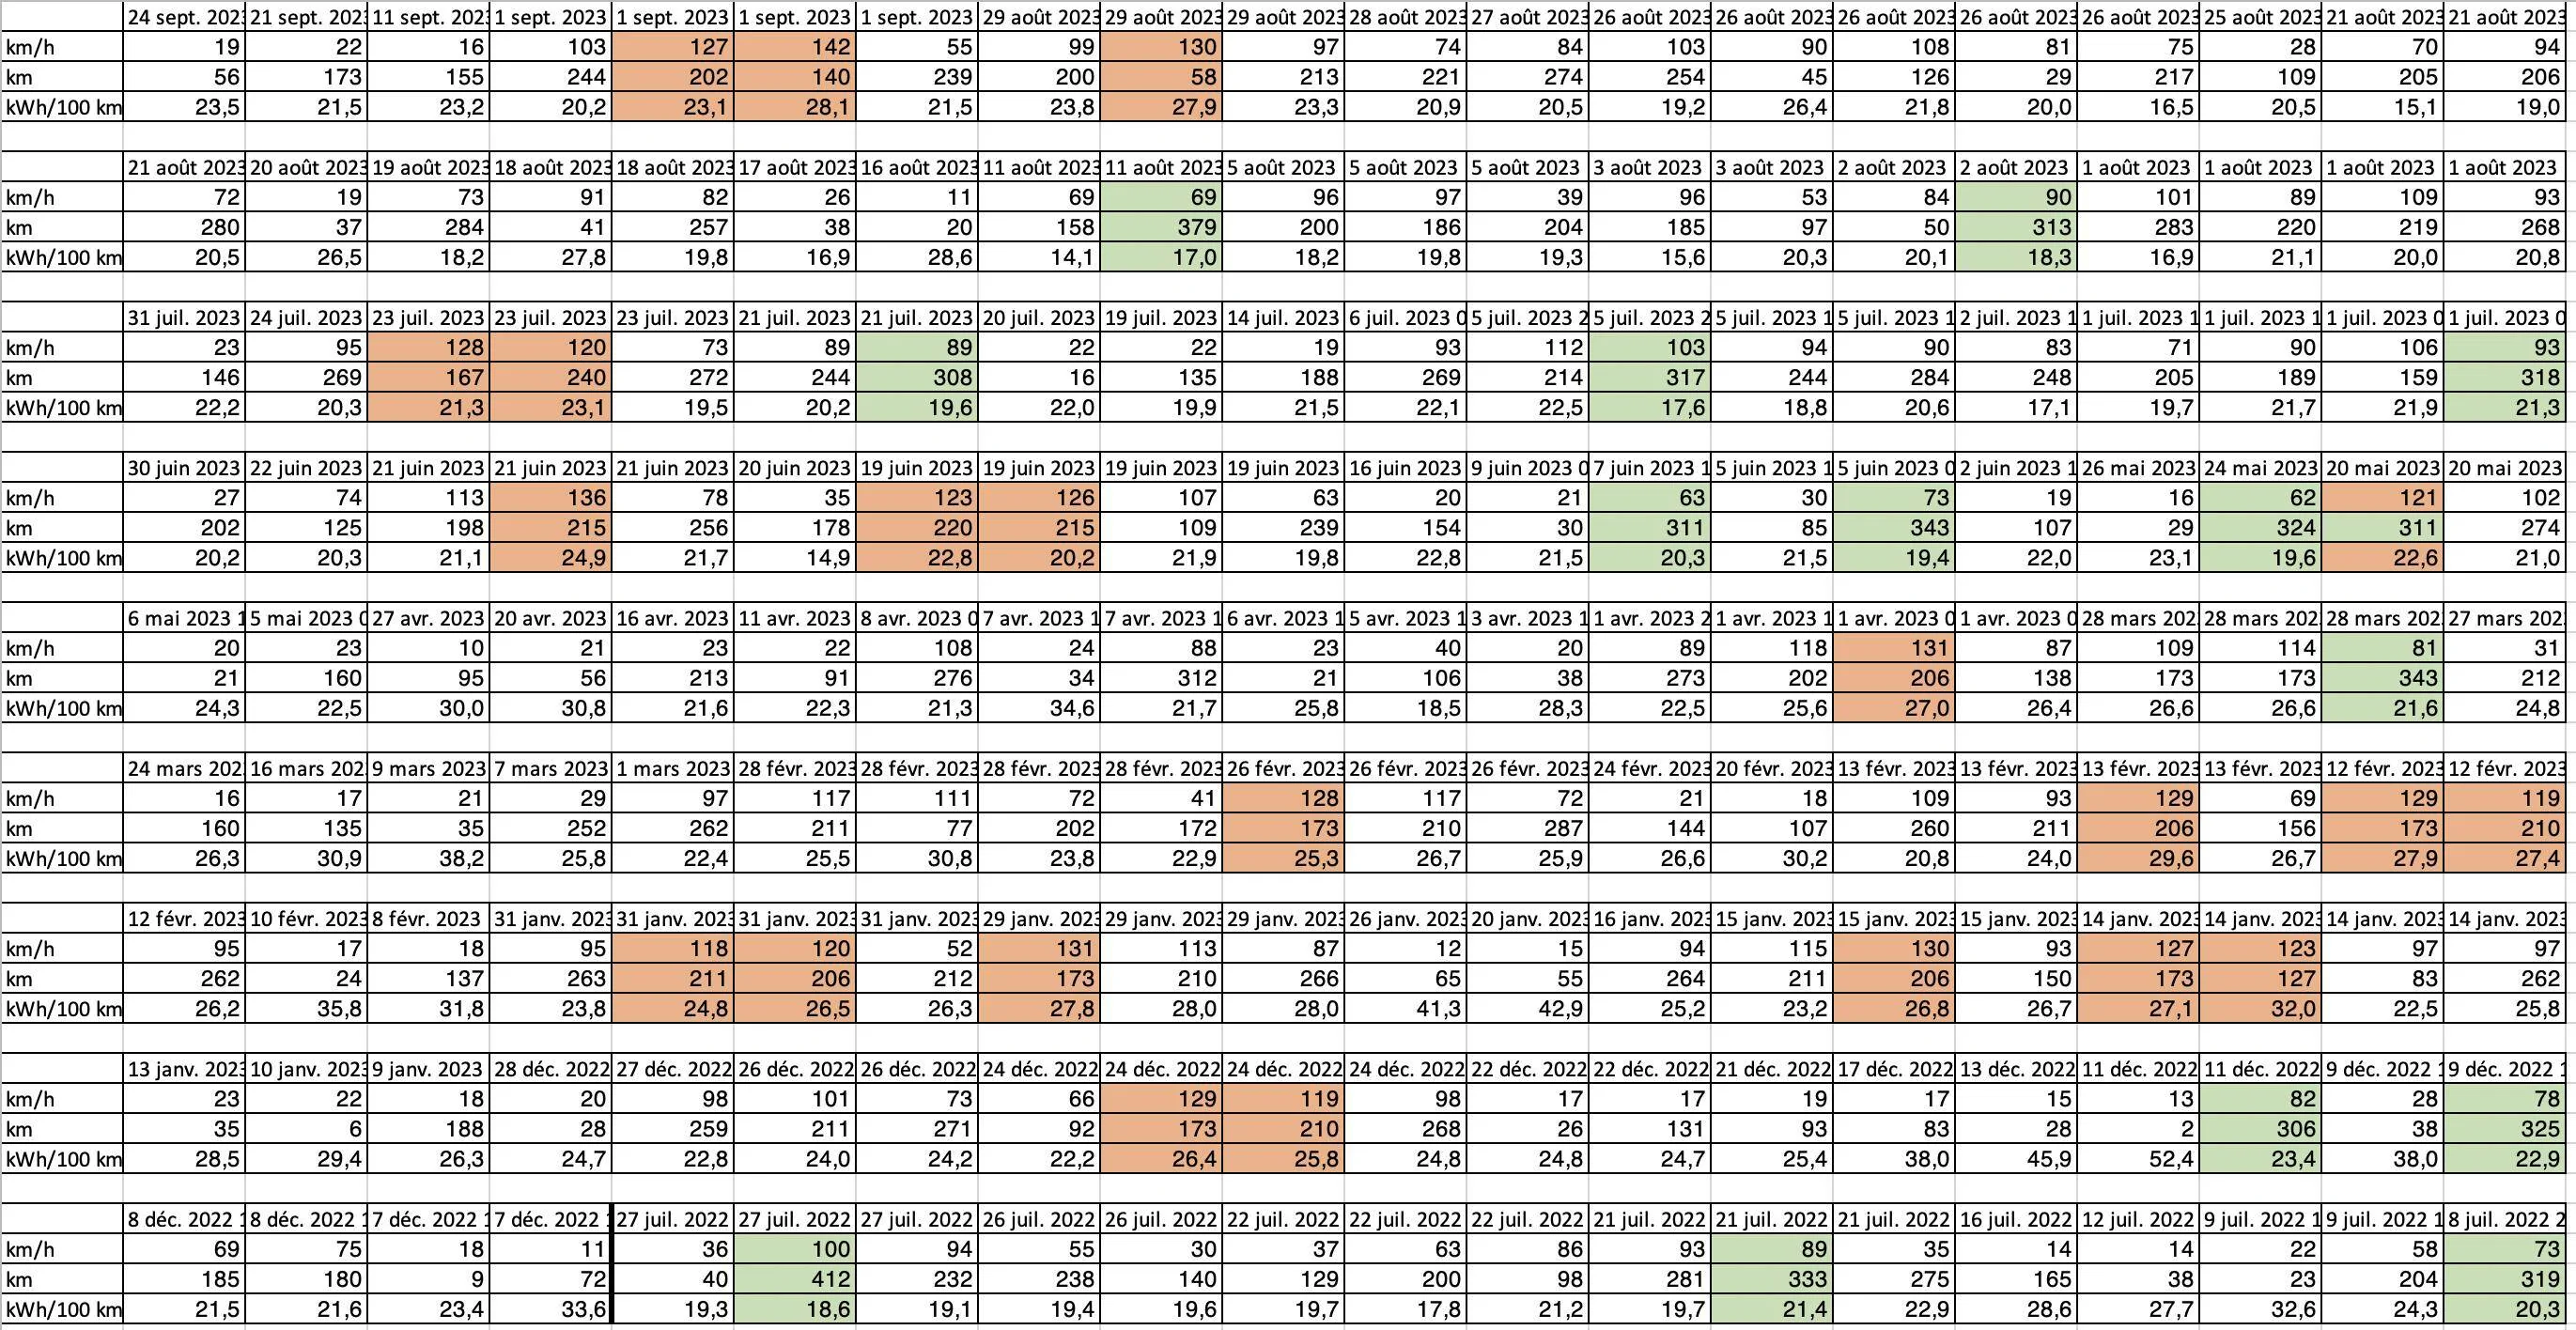
I've derived close to identical results using the total kWh I have charged my car to date and miles driven over 2 years (yes I logged it all!) and the driver SOH is within error of the above methods. You can do this on a per trip basis (but no longer averaging over car's history but simply over one trip) and get analogous results.
Range
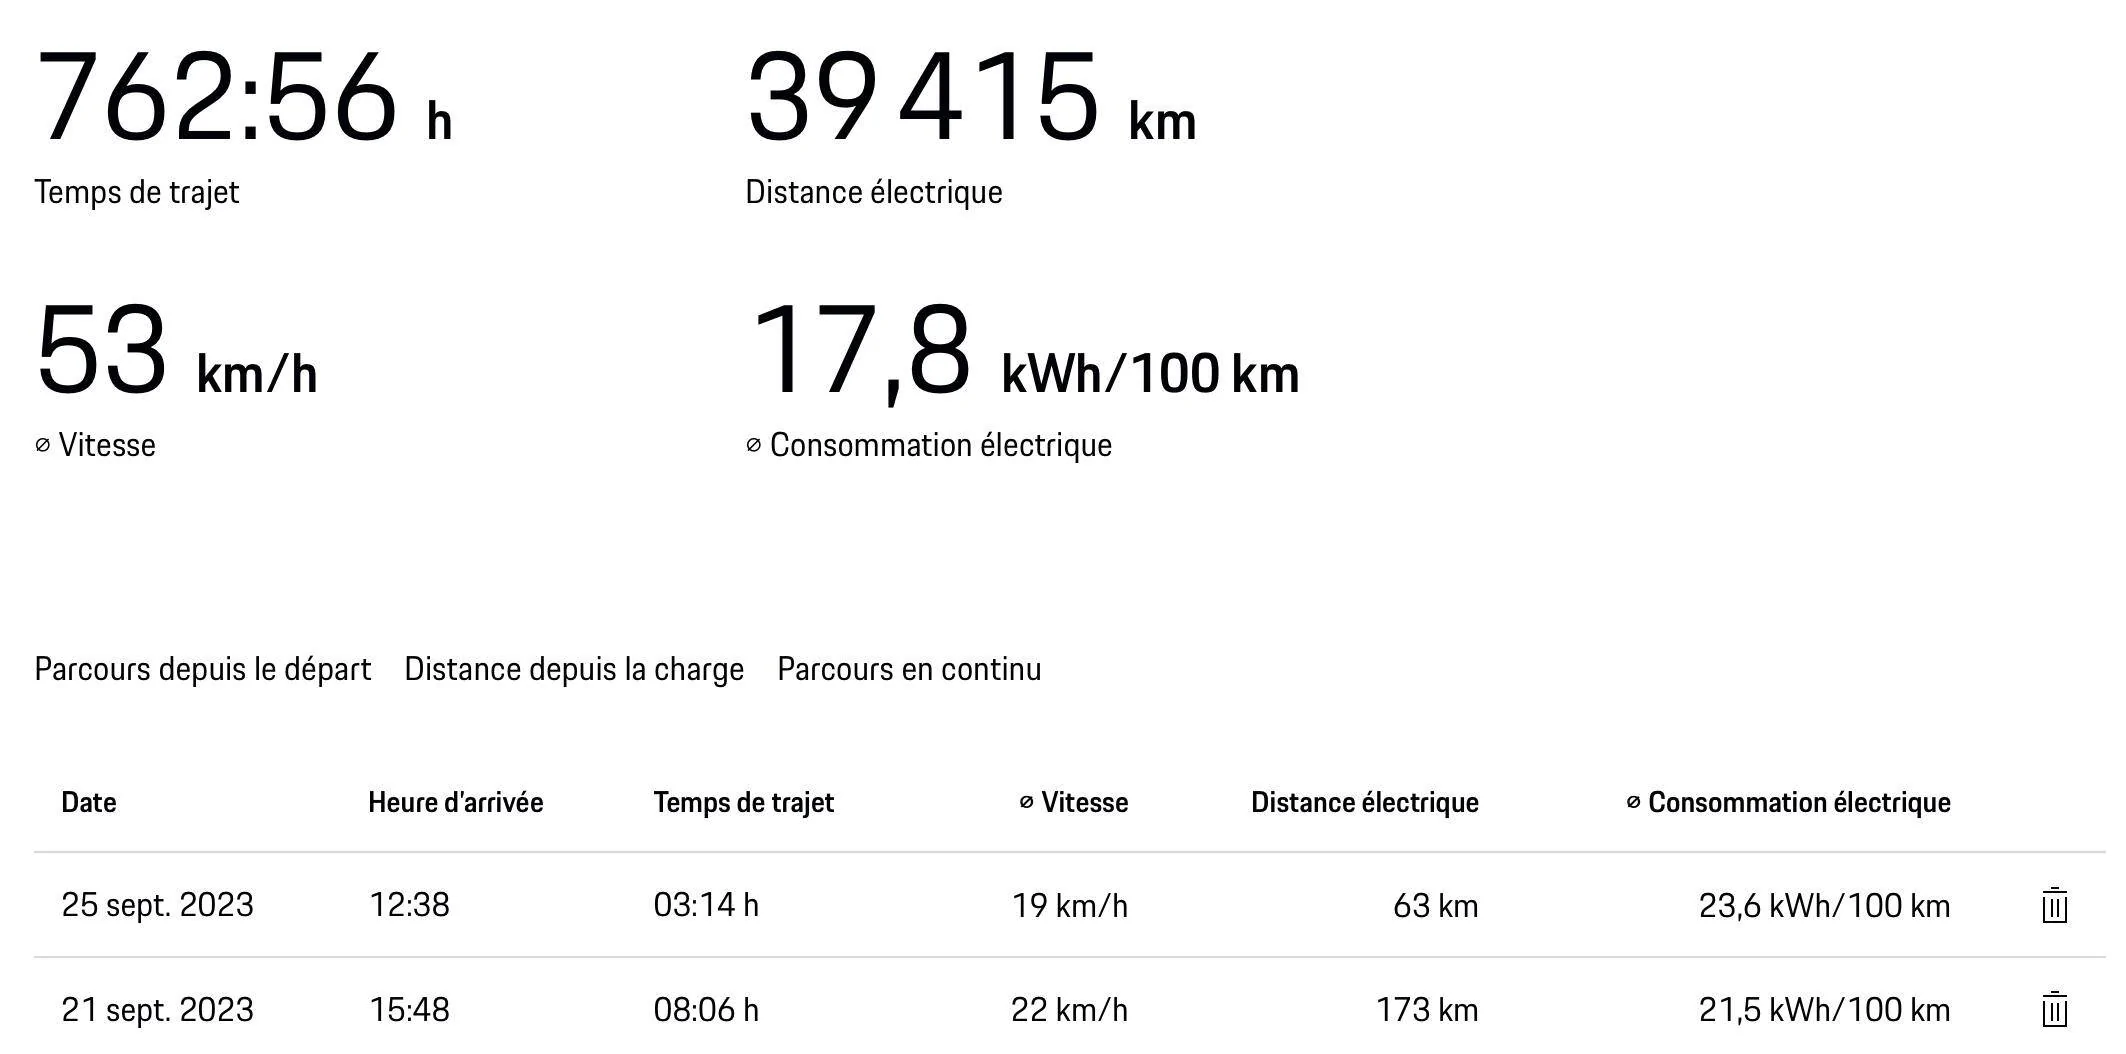
Now when we calculate Range using averaged consumptive data provided by our cars (via MyPorsche app) we get values (as discussed above) that are always quite a bit lower than the GoM max. potential ranges (excluding active navigation estimates).
My current total car history consumptive average is 36.7 kWh per 100 miles.
Using mi per Kwh = 100/(kWh per 100mi), this is equivalent to 2.73 miles per kWh.
My 'Battery Energy' data (OBDII term for available usable KWh at reported SoC), as by coincidence in the example above, also calculates to 76.3 kWh based on my SoH of 88%.
So an average Range based off my car's current usable kWh and average consumption history would be:
(76.3/36.7)*100 = 207.9 miles
Again just a 'simple' average (using compound averages) but pretty close to original Porsche published range for the car") - the actual max. attained range in the spread about this real consumptive mean is as high as 260 miles on a full charge (when you consider 21" wheels, generally fast driving and AC always on, this is quite good imo).
- the actual max. attained range in the spread about this real consumptive mean is as high as 260 miles on a full charge (when you consider 21" wheels, generally fast driving and AC always on, this is quite good imo).
Apologies, a bit overly verbose and less than succinct - but also arguably too simplistic as many variable not discussed!
Hopefully helps to differentiate different range estimates as derived and how/why they can be substantially different.
Cheers, C.
1) PCM 'Guessometer' or 'GoM' Ranges using current SoC are the most optimistic and are calculations (predictions) biased towards the most efficient ride pattern recorded from a subset of your most recent trips.
2) Range derived from consumption data from your cars total trip history will provide an equivalent full SoC range that will always be lower than the max. Guessometer range.
3) With the correct OBDII tool you can get a reasonably accurate estimation of your SoH (how much you HV Battery has degraded). This will allow you to determine usable kWh and thus provide another measure of potential range at 100% SoC.
PCM range estimates should by default be considered maxima - despite oddly enough, something that is presented to you every time you start up your car, it is in reality simply a range you might attain with very diligent, efficient driving but otherwise quite optimistic. By contrast, if following an active PCM navigation route/PIRM estimates of SoC on arrival are in fact very accurate as in this special case the car is reacting to as-is conditions both in respect driving style but also terrain/climate etc. This is a distinctly different case to the Dash reported range and SoC when not using an entered active navigation route.
____________________________________
Some Data
This chart records my entire trip history up to Sep. 2023. Data points in blue are calculations of max. range based off the reported consumption used for that trip. In green are max. ranges for a sample 50 charge sessions (consistent SoH) calculated by the PCM (Guessometer) for an equivalent 100% SoC (I always charge to 85% and use the associated GoM range to calculate range for 100% SoC).
Clearly the GoM Ranges are distinctly higher than those calculated using average consumptive data. However this should not be a surprise!
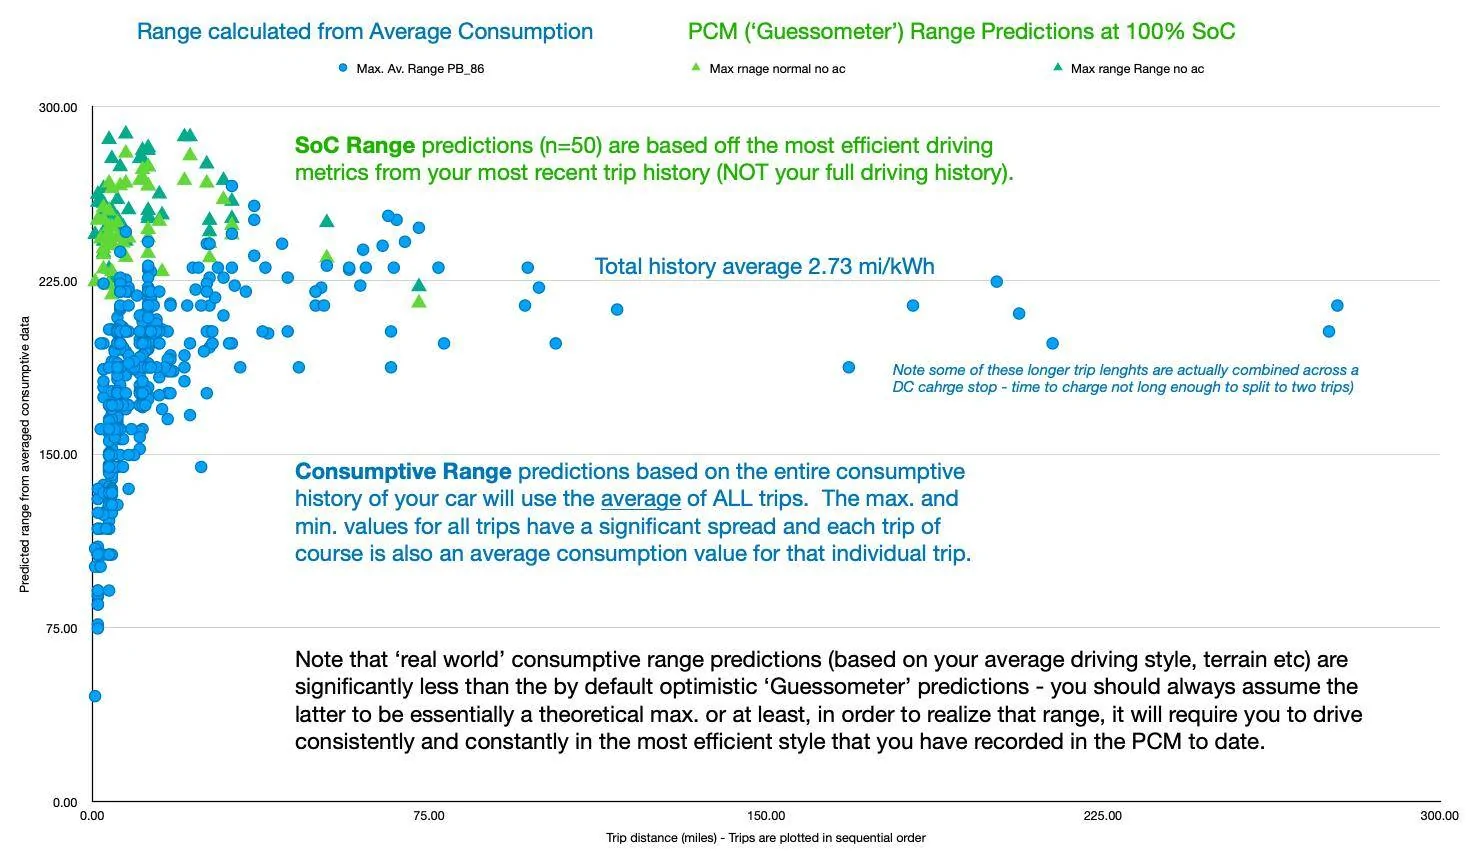
There has been a lot of back and forth on the range the PCM calculates and displays in your dash vs what can be calculated in respect kWh consumed over miles driven etc. - PCM 'Guessometer' vs actual 'Consumptive' range. The key differentiator here being that the GoM only uses recent driving trips and from these determines you most efficient driving style/terrain covered to (I believe) calculate a 'theoretical' maximum range if you stick entirely to that efficient driving model. By contrast consumptive data whilst averaged for each trip does not differentiate inefficient vs efficient trips and thus any Range calculation from these data will of course be lower than the 'theoretical' GoM predictions.
A key and very important exception and validated by numerous forum members, is the ability of the PCM Navigation trip planner/PIRM to predict arrival SoC from an entered map route which seems to be highly accurate. Without a mapped route, the PCM in not knowing what terrain you are about to drive or exactly how aggressive or passive you are about to be in your driving stye, it simply instead calculates a theoretical potential maximum range should you decide to drive in the most efficient way you have recorded/demonstrated to date for those predicted miles.
So again, when we calculate range from average efficiency numbers we are obviously not going to see the predicted maximums provided by the GoM. These efficiency averages are just that - they are derived from your full driving history not the last few trips, and are not showing/providing what the actual min-max or variance is around those averages. So again, we should of course expect ranges derived from average consumptive kWh per mile to be less than those provided by the GoM.
As an aside, it is worth noting the following in your warranty booklet:
The Baseline Soh thread on this Forum most definitely highlights the last point i.e. heat stress is the biggest factor in battery degradation (for a host of physical and chemical reasons beyond scope here). Note too that simply having your car sit in extreme hot climates will still degrade your battery i.e. it is not simply miles driven (in fact you could argue active cooling systems better protect the battery when being driven vs sitting static in heat!). Perfect example is my and another local Hot Climate zone car with identical Soh degradation with my car having less than half the miles driven.
Measuring SoH
Some ways to measure Soh for Consumptive/Soh derived range:
OBDII Tool:
The OBDII tool lists two useful measures (and we have multiple PIWIS 'quick' ECU reads that exactly match and validate equivalent OBDII data to date):
1) your current HV Battery 'Soh' or State of Health and
2) current 'Battery Energy' - basically kWh remaining of usable battery power at your current Battery SoC (State of Charge).
Example (real case) Forum car:
OBDII SoH reads = 88%
Note: A new Taycan with PB+ has 86.7 kWh (not the published 83.7) unbuffered or usable battery energy.
So with 12% degradation this car's current usable battery energy at 100% SoC is 86.7*.88 = 76.3 kWH.
PCM SoC at time of OBDII measurements = 75%
OBDII Battery Energy value reads = 57.15 kWh
So we can separately derive this car's current usable SoH from Battery Energy and SoC as 57.2/0.75 = 76.3 kWh
I've derived close to identical results using the total kWh I have charged my car to date and miles driven over 2 years (yes I logged it all!) and the driver SOH is within error of the above methods. You can do this on a per trip basis (but no longer averaging over car's history but simply over one trip) and get analogous results.
Range
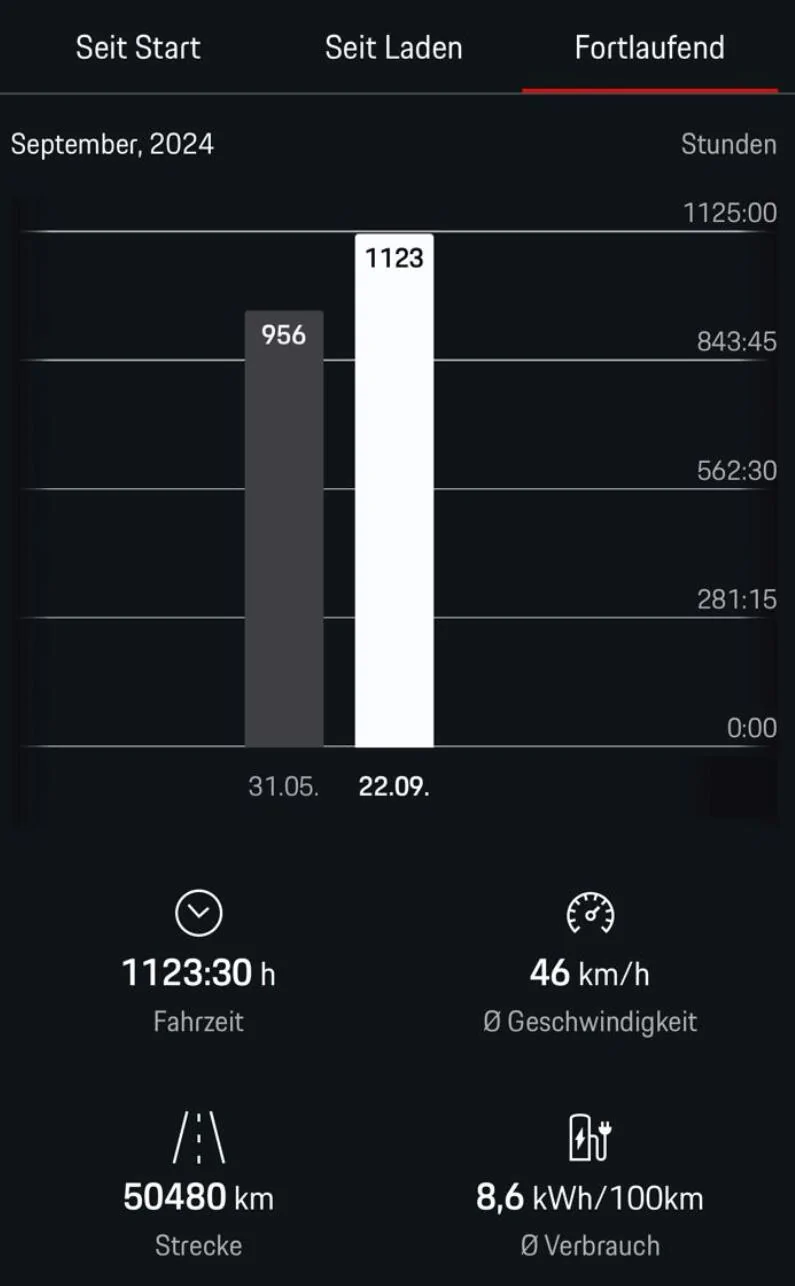
Now when we calculate Range using averaged consumptive data provided by our cars (via MyPorsche app) we get values (as discussed above) that are always quite a bit lower than the GoM max. potential ranges (excluding active navigation estimates).
My current total car history consumptive average is 36.7 kWh per 100 miles.
Using mi per Kwh = 100/(kWh per 100mi), this is equivalent to 2.73 miles per kWh.
My 'Battery Energy' data (OBDII term for available usable KWh at reported SoC), as by coincidence in the example above, also calculates to 76.3 kWh based on my SoH of 88%.
So an average Range based off my car's current usable kWh and average consumption history would be:
(76.3/36.7)*100 = 207.9 miles
Again just a 'simple' average (using compound averages) but pretty close to original Porsche published range for the car
- the actual max. attained range in the spread about this real consumptive mean is as high as 260 miles on a full charge (when you consider 21" wheels, generally fast driving and AC always on, this is quite good imo). Apologies, a bit overly verbose and less than succinct - but also arguably too simplistic as many variable not discussed!
Hopefully helps to differentiate different range estimates as derived and how/why they can be substantially different.
Cheers, C.
Sponsored