JimBob
Well-Known Member
- First Name
- James
- Joined
- Jan 26, 2021
- Threads
- 75
- Messages
- 950
- Reaction score
- 1,109
- Location
- Toronto Canada
- Vehicles
- Taycan 4S
- Thread starter
- #1
This is what happens when you are under lockdown with nothing else to do.
If you go to your car and cycle among the drive modes you might get something that looks like this.
So you may be thinking that if I drive in Sport+ I will only loose 22 km over Range mode. (Hint, not)
These tests have not been converted to imperial measurements. I will probably get around to that later if someone wants to see them.
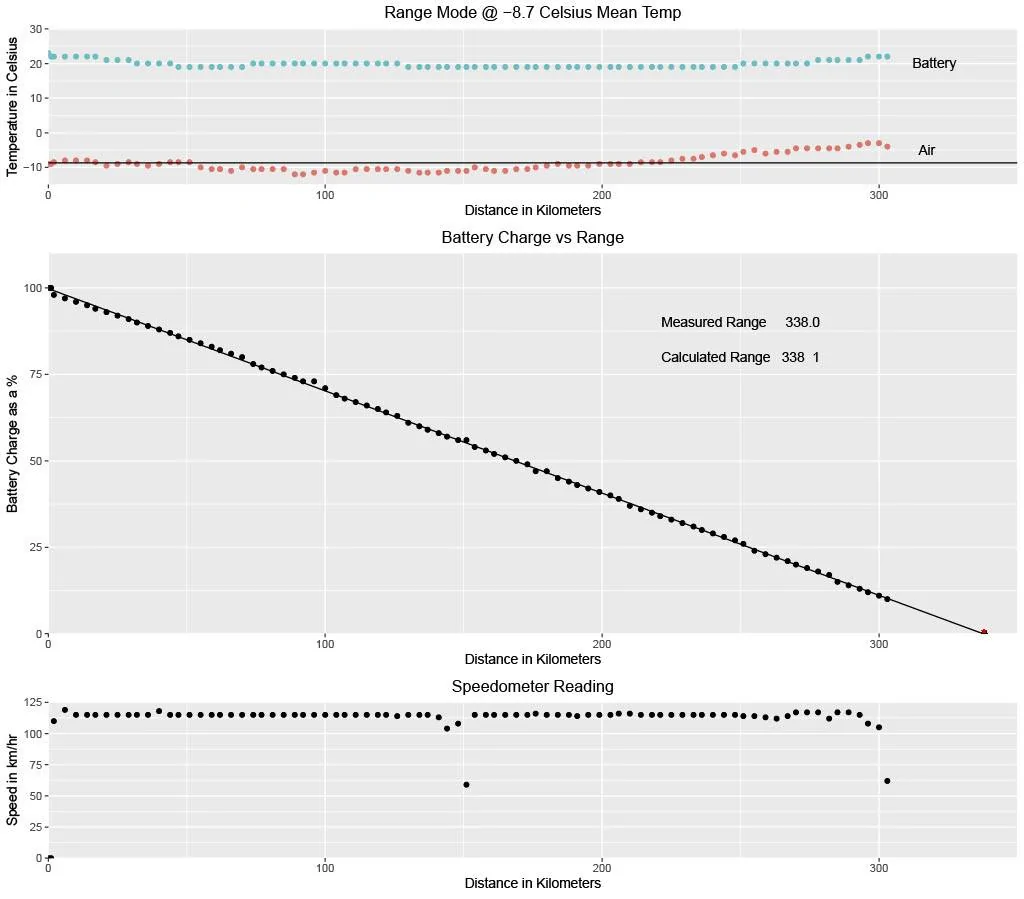
The test was a loop out and back with 25 minutes under each mode. Temperatures were pretty constant around -7C and wind was under 12 kph as a cross wind. Observations were made at 1-minute intervals. Cruise control was set to 115 kph and traffic was light.
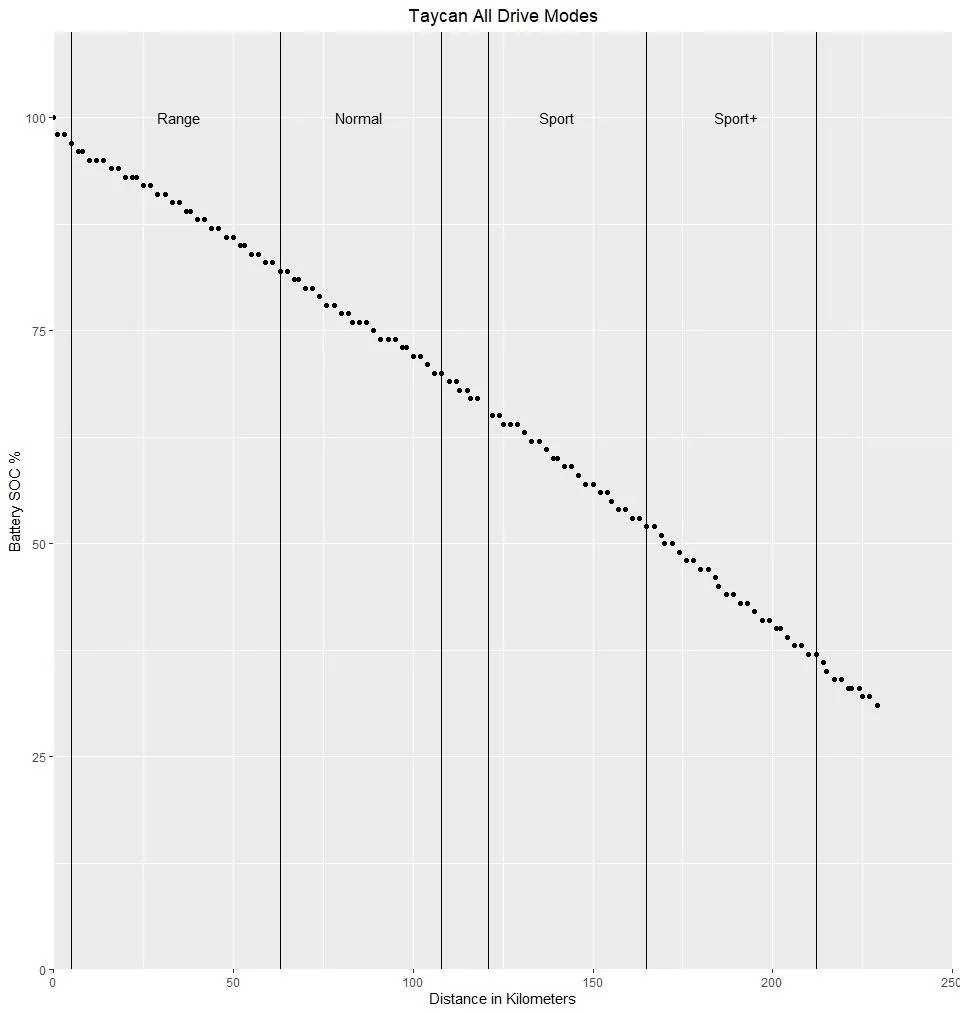
Chart 1 is a plot of all the observations made. If you were to look at it, you would be hard pressed to identify the range modes. There appears to be a slight bend to the data, but nothing to get excited about.
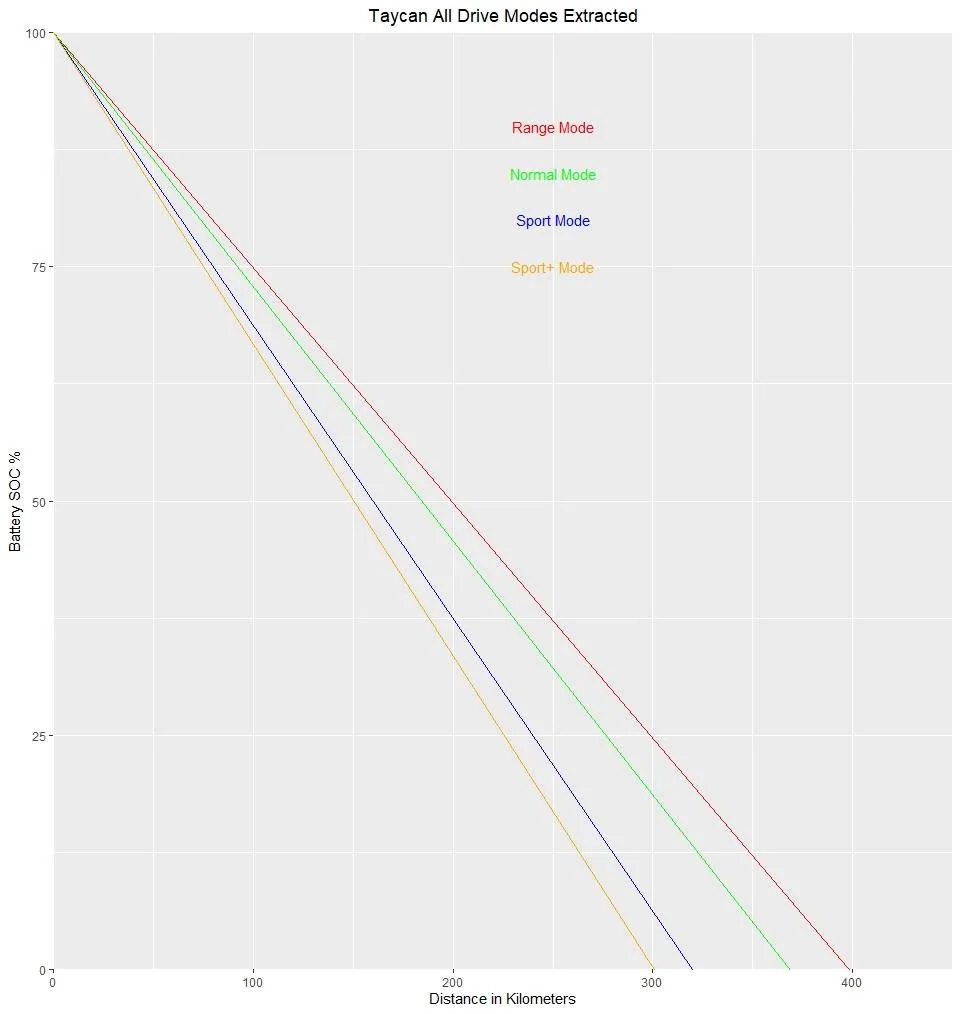
Chart 2 is a plot of the observations for each mode, extracted from Chart 1 and the differences now appear. A linear model was applied to the data for each mode and a best fit linear line plotted. The standard error of the estimate and RSquare for each of the modes are highly supportive that at constant speed (load) the relationship of SOC to distance is linear.
Conclusions
The changes in indicated ranges on the dash, look a bit (a lot) light, but this may depend on how Porsche thought you were driving prior to departure.
Sport and Sport + are energy pigs when compared to Range and Normal.
Small gains and losses applied over the range of a trip, mean big differences at the end.
It is very easy for Range gains to be swamped by outside factors such as changes in elevation and head winds.
If you want to totally kill your range drive at high speed in Sport +, up hill, into a head wind, in sub-zero temperatures with a bike on your roof. If you want to extend your range to the max, do the opposite.

If you go to your car and cycle among the drive modes you might get something that looks like this.
Indicated Range in km | Difference | |
| Range | 294 | 0 |
| Normal | 286 | 8 |
| Sport | 279 | 7 |
| Sport + | 272 | 7 |
So you may be thinking that if I drive in Sport+ I will only loose 22 km over Range mode. (Hint, not)
These tests have not been converted to imperial measurements. I will probably get around to that later if someone wants to see them.
The test was a loop out and back with 25 minutes under each mode. Temperatures were pretty constant around -7C and wind was under 12 kph as a cross wind. Observations were made at 1-minute intervals. Cruise control was set to 115 kph and traffic was light.
Chart 1 is a plot of all the observations made. If you were to look at it, you would be hard pressed to identify the range modes. There appears to be a slight bend to the data, but nothing to get excited about.
Chart 2 is a plot of the observations for each mode, extracted from Chart 1 and the differences now appear. A linear model was applied to the data for each mode and a best fit linear line plotted. The standard error of the estimate and RSquare for each of the modes are highly supportive that at constant speed (load) the relationship of SOC to distance is linear.
Conclusions
The changes in indicated ranges on the dash, look a bit (a lot) light, but this may depend on how Porsche thought you were driving prior to departure.
Sport and Sport + are energy pigs when compared to Range and Normal.
Small gains and losses applied over the range of a trip, mean big differences at the end.
It is very easy for Range gains to be swamped by outside factors such as changes in elevation and head winds.
If you want to totally kill your range drive at high speed in Sport +, up hill, into a head wind, in sub-zero temperatures with a bike on your roof. If you want to extend your range to the max, do the opposite.
Sponsored
Last edited: