
Regular
Member
- First Name
- Tom
- Joined
- Apr 15, 2025
- Threads
- 1
- Messages
- 15
- Reaction score
- 27
- Location
- Denmark
- Vehicles
- Taycan 4S CT
- Thread starter
- #1
I wanted to start sharing some findings from analysing the battery and charging data I have collected. Will update this post if I find more that might be of interest.
My motivation was originally just to understand if there were any benefits from my replacement battery, but I ended up having to dig pretty deep in some of the J1.1 data also to understand the difference.
A little background:
Net capacity and buffers
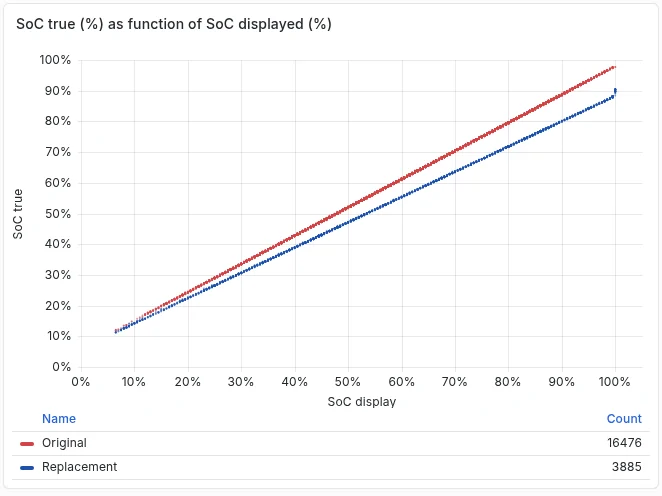
Looking at the correlation between SoC Display and SoC "true"* for both batteries:

[C6. CHRGR] SoC True in Car Scanner or BMS_SOC_HiRes in Porsche telemetry. SoC HR in Car Scanner is low-res of SoC true.
Original: SoC_true = 92%*SoC_display + 6%
Replacement: SoC_true = 82%*SoC_display + 6%)
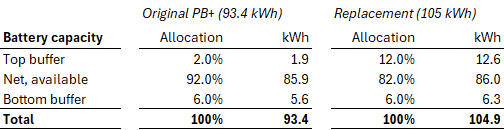
This tells us that the battery capacity is allocated this way:

I believe the % allocated and energy available is slightly higher (~86.6-87.0 kWh) than shown here due to %-rounding and such.
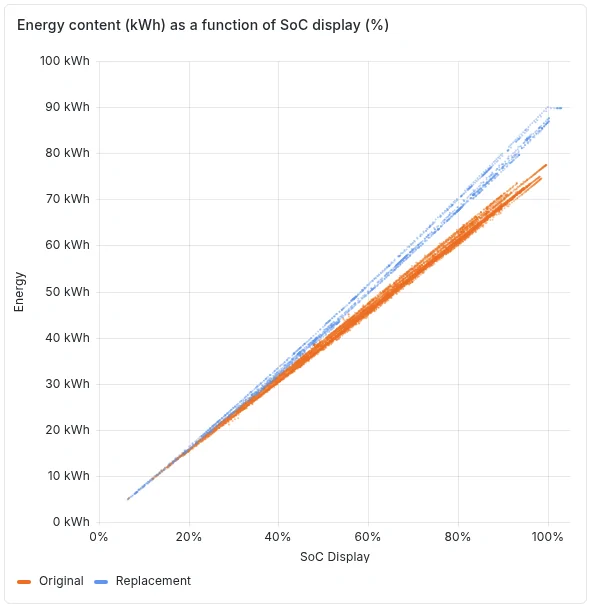
Energy content
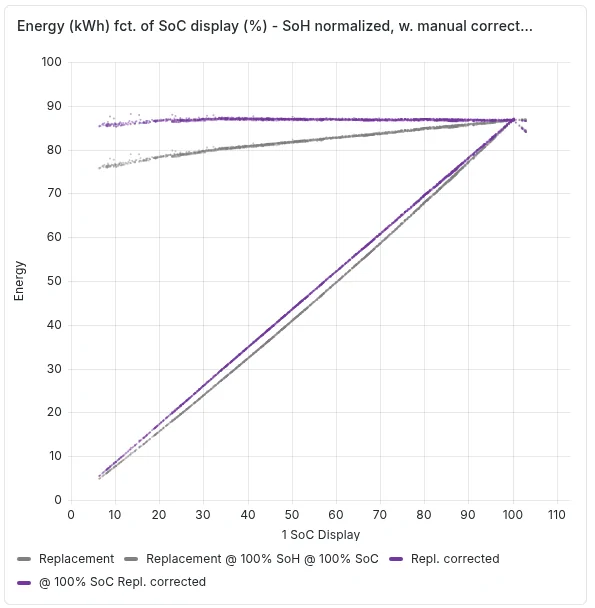
Reported Energy content (kWh) vs SoC:

Spread for each battery and between the two batteries due to difference in SoH.
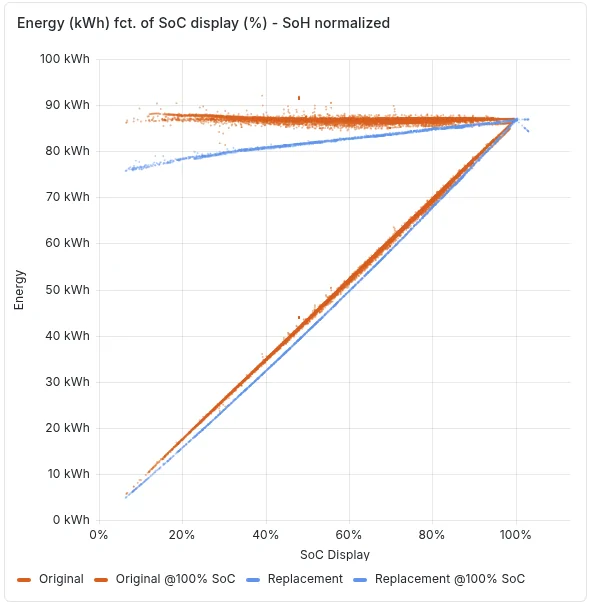
Normalizing Energy to 100% SoH cleans it up:

- Energy normalized back to 100% SoH (Made a separate post on SoH readings for J1.2 BMS)
- Numbers converge on 86.5-87.0 kWh at 100% for both batteries.
- Normalizing to 100% SoC shows a mostly flat curve for the original battery, but not for the replacement?
Non-linear energy/SoC curve for the replacement battery:
- Appears as if new battery reports only 88% of energy at ~0% SoC but converges to 100% at 100% SoC
- Divide by 88%+12%*SoC gives a perfectly linear function
I believe the Energy (kWh) is used by the GOM (range indicator) so it has driver implications. See two options:
Fast charging statistics
Below chart shows individual charging sessions as a function of SoC and Battery temperature. Color indicates max charging power indicated by the BMS. Yellow color (and largest point sizes) indicates max (335A). New battery sessions are square, old battery round.

It can be a bit difficult to interpret, but there does not appear to be any difference in fast charging performance.
I don't have data for more than one proper fast charging session with the old battery so I'm not sure exactly where the temperature cutoffs are on the J1.1.
Will add more details around charging later, for now here is link to two sessions with charging limits, temps, etc.:
DC session (new batt.)
DC Session (old batt.)
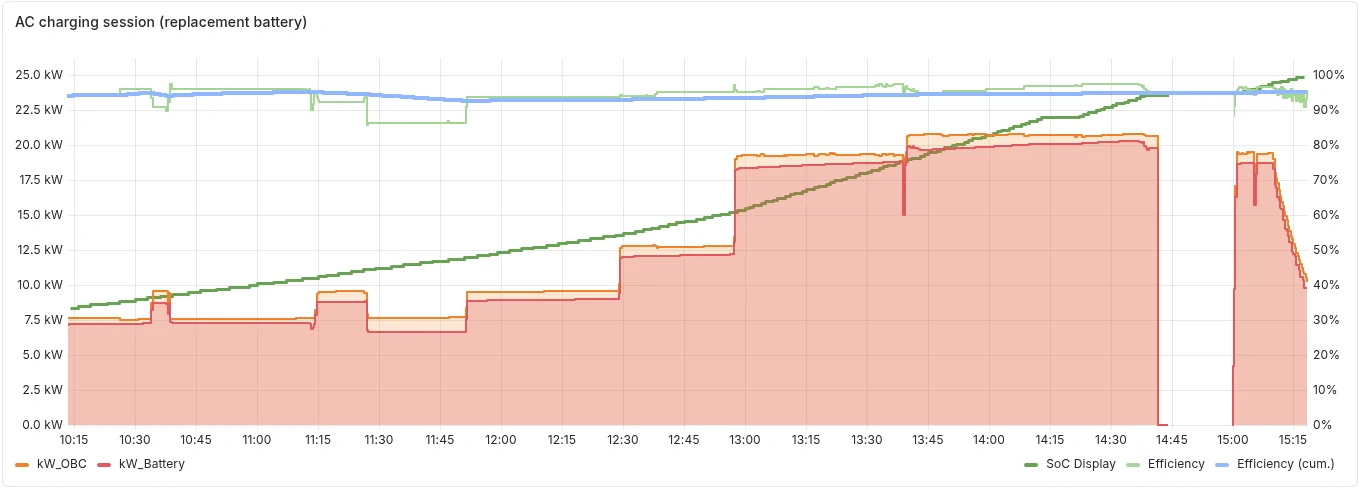
AC Charging
Maybe not the most interesting, but here is a typical AC charging session.
Shown is power into OBC and into the battery - and their ratio (efficiency):

Mapping efficiency as function of the power draw of the OBC (4 dates):

For the 22kW OBC ~95% efficiency @ >10-11 kW, but drops quickly at low power levels
(It's typical that efficiency drops below nominal power, so may be different for the 11kW)
Let me know if you have any questions. Will add more, just need time to process and collect.
My motivation was originally just to understand if there were any benefits from my replacement battery, but I ended up having to dig pretty deep in some of the J1.1 data also to understand the difference.
A little background:
- I had the PB+ in my 2023 CT4s replaced in March 2026 with a J1.2 (105 kWh) part. To verify, I asked for the proforma service invoice: Part number was 9J1915590RX and spare parts matches the TSB including the PDCC brackets (although they used the non-PDCC APOS code). Car now has a fibreglass bottom.
- Most of the data is Porsche telemetry data (5 months old battery, 3 months new): Available in EU since September 2025 (data.porsche.com). This was the biggest revelation as it provided a solid and directly comparable foundation for both batteries.
- Supported by Car Scanner recording which usually are higher frequency which is helpful in a few edge cases
- No functional difference in terms of range or fast charging observed
- 95% SoC is the new 85% SoC
- (Not related to battery type: Improved range as SoH went from 87% to 100%)
Net capacity and buffers
Looking at the correlation between SoC Display and SoC "true"* for both batteries:
[C6. CHRGR] SoC True in Car Scanner or BMS_SOC_HiRes in Porsche telemetry. SoC HR in Car Scanner is low-res of SoC true.
Original: SoC_true = 92%*SoC_display + 6%
Replacement: SoC_true = 82%*SoC_display + 6%)
This tells us that the battery capacity is allocated this way:
I believe the % allocated and energy available is slightly higher (~86.6-87.0 kWh) than shown here due to %-rounding and such.
Energy content
Reported Energy content (kWh) vs SoC:
Spread for each battery and between the two batteries due to difference in SoH.
Normalizing Energy to 100% SoH cleans it up:
- Energy normalized back to 100% SoH (Made a separate post on SoH readings for J1.2 BMS)
- Numbers converge on 86.5-87.0 kWh at 100% for both batteries.
- Normalizing to 100% SoC shows a mostly flat curve for the original battery, but not for the replacement?
Non-linear energy/SoC curve for the replacement battery:
- Appears as if new battery reports only 88% of energy at ~0% SoC but converges to 100% at 100% SoC
- Divide by 88%+12%*SoC gives a perfectly linear function
I believe the Energy (kWh) is used by the GOM (range indicator) so it has driver implications. See two options:
- Intentional to add some buffer at the low end of the charge (do we see it on J1.2?)
- Mistake in adaptation for J1.1
Fast charging statistics
Below chart shows individual charging sessions as a function of SoC and Battery temperature. Color indicates max charging power indicated by the BMS. Yellow color (and largest point sizes) indicates max (335A). New battery sessions are square, old battery round.
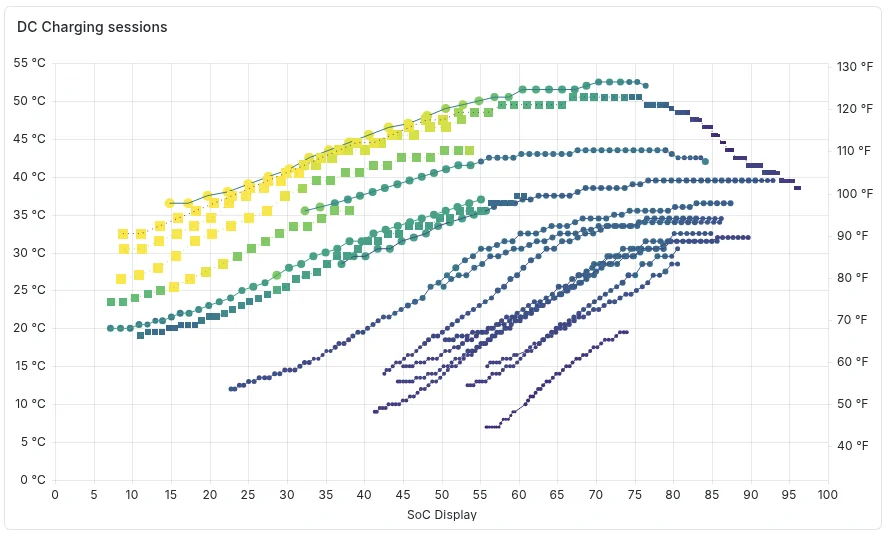
It can be a bit difficult to interpret, but there does not appear to be any difference in fast charging performance.
- Max charging power remains ~270 kW (335 A)
- Lowest temperature for max continous power I have achieved with the new battery 32C@8% SoC
I don't have data for more than one proper fast charging session with the old battery so I'm not sure exactly where the temperature cutoffs are on the J1.1.
Will add more details around charging later, for now here is link to two sessions with charging limits, temps, etc.:
DC session (new batt.)
DC Session (old batt.)
AC Charging
Maybe not the most interesting, but here is a typical AC charging session.
- 22kW on-board charger (OBC)
- EU: so 3 phase 230V/400V @ 32A
Shown is power into OBC and into the battery - and their ratio (efficiency):
Mapping efficiency as function of the power draw of the OBC (4 dates):
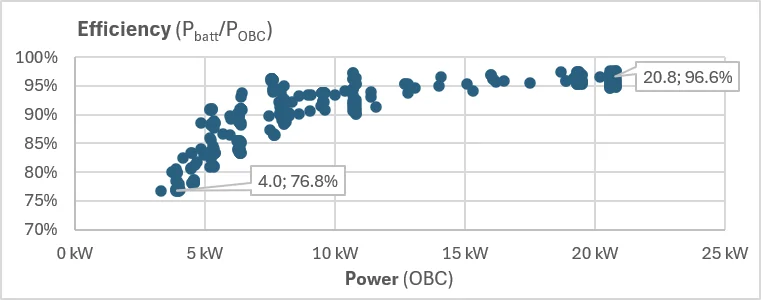
For the 22kW OBC ~95% efficiency @ >10-11 kW, but drops quickly at low power levels
(It's typical that efficiency drops below nominal power, so may be different for the 11kW)
Let me know if you have any questions. Will add more, just need time to process and collect.
Sponsored
Last edited: