OP
OP
ciaranob
Well-Known Member
- Joined
- Jul 3, 2021
- Threads
- 83
- Messages
- 3,547
- Reaction score
- 2,639
- Location
- Houston, TX
- Vehicles
- CT4S 2022 Mini Cooper S 2024 Electric in 2025/6
- Thread starter
- #166
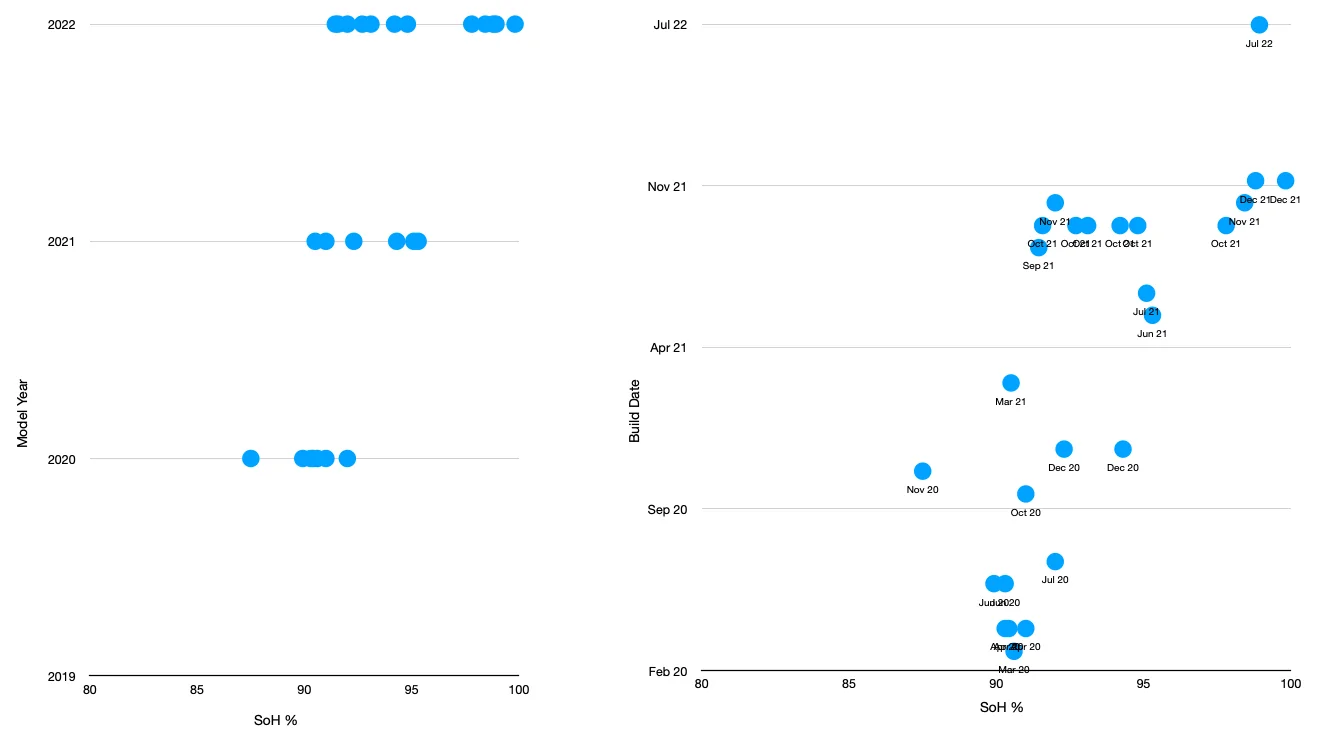
Chart updatedSo here is my first update:
1. 99,8
2. 97,28
3. 5368 miles
4. 836 kW
I only used battery-saving fast charging, no faster than 200 kW. 6 times charged to 100%. We have cold temperatures in Germany since delivery ( 0-5°C) in December. The only drops in SoH were when unintended charged to 100% and not moved for a couple of hours ( 1x the shop that did PPF, 1x timer did not work when photovoltaic dependent charging, 2 times unintentionally "direct charging" when i actually wanted to use a timer) I wonder whether these incidents caused the drop of SoH or is the car updating its SoH when charged to 100%.

Sponsored
") ?
?