OP
OP
ciaranob
Well-Known Member
- Joined
- Jul 3, 2021
- Threads
- 83
- Messages
- 3,547
- Reaction score
- 2,639
- Location
- Houston, TX
- Vehicles
- CT4S 2022 Mini Cooper S 2024 Electric in 2025/6
- Thread starter
- #181
Meant to add that we've seen some variation in SoH readouts with OBDII's depending on a number of factors so indeed will be interesting when you take addl readings as to whether you 'recover' a percentage point as some have - I've actually seen the opposite!!15000km.
Sponsored
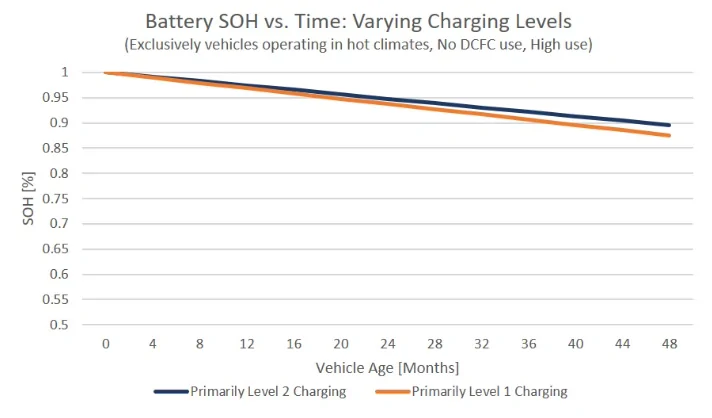
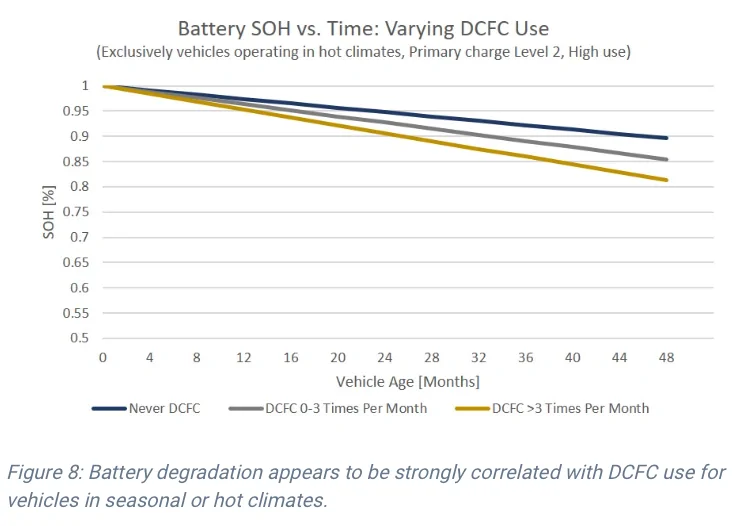
") ) of future extrapolation of the SoH logarithmic curves for each climate zone.
) of future extrapolation of the SoH logarithmic curves for each climate zone.