
tutis
Well-Known Member
- Thread starter
- #1
I've put together a simple model that calculates the optimal driving speed based on what is the achievable charging speed. The model takes as input the consumption of the car at multiple speeds and generates curve from there. The model can be used for any EV, provided that the inputs are adjusted
The inputs include:
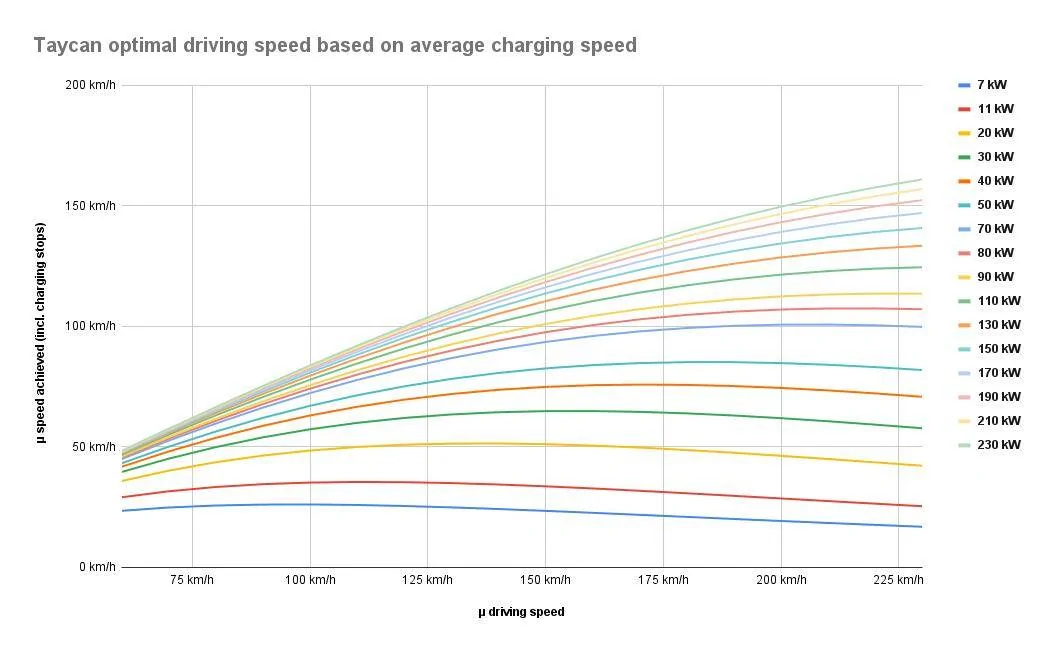
Here are the output curves for given average charging speeds:

The optimal speed for a given curve is where that curve peaks; e.g. if you can only achieve 11kW charging speed, then your optimal driving speed is around 100km/h. For 50kW it is around 175 km/h
For those who want to copy/edit the model it is accessible here
All inputs are in yellow boxes, and to re-run the model first delete everything in the H45:Z60 area, then click on Extensions > Whatif > Refresh Data Tables and wait until it is done working
Let me know if you have any comments or questions
The inputs include:
- battery net capacity
- total distance of driving trip (as obviously if no charging stops are needed, then optimal driving speed is infinite)
- and speed consumption at various speeds. For this model I have used the following, although this may vary for winter vs. summer, 22" vs 20" etc. you get the idea
| Speed | Consumption |
| 50 km/h | 16 kWh/100kms |
| 70 km/h | 17 kWh/100kms |
| 90 km/h | 19 kWh/100kms |
| 110 km/h | 21 kWh/100kms |
| 130 km/h | 24 kWh/100kms |
| 150 km/h | 26 kWh/100kms |
Here are the output curves for given average charging speeds:
The optimal speed for a given curve is where that curve peaks; e.g. if you can only achieve 11kW charging speed, then your optimal driving speed is around 100km/h. For 50kW it is around 175 km/h
For those who want to copy/edit the model it is accessible here
All inputs are in yellow boxes, and to re-run the model first delete everything in the H45:Z60 area, then click on Extensions > Whatif > Refresh Data Tables and wait until it is done working
Let me know if you have any comments or questions
Sponsored